

The price of Zcash is extending its explosive rally, climbing 14% in today's trading session and pushing monthly gains over 200%. The token for privacy (ZEC) has surged more than 1,130% in the past three months, one of the most pronounced upturns in the market.
While indicators continue to signal a bullish momentum, highly leveraged trading could make the road to higher targets - including $1.567 - far from risk-free.
The Hidden Bullish Divergence Keeps Zcash's Rally Intact
Between October 3 and October 30, ZEC's price formed a higher low, while the Relative Strength Index (RSI) - a tool that tracks buying and selling strength - created a lower low.
This is known as a hidden bullish divergence, which often signals that an ongoing uptrend is likely to continue.
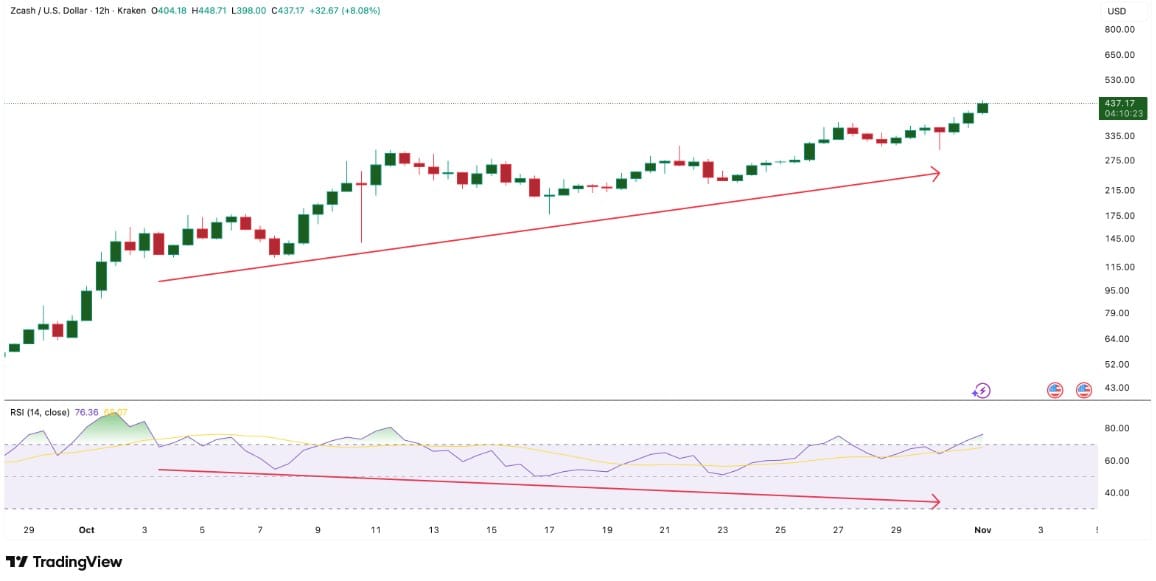
The RSI of Zcash remains above 70, showing strong control by buyers despite brief bouts of profit-taking. The pattern suggests that traders are re-entering rather than exiting, keeping the trend intact. However, a rising RSI number could possibly lead to a pullback-like scenario for Zcash.
Supporting this general uptrend, the Chaikin Money Flow (CMF) - which measures the entry or exit of large capital into or out of the market - remains positive. ZEC's CMF has not fallen below zero for weeks and currently stands at around 0.05, showing steady inflows.
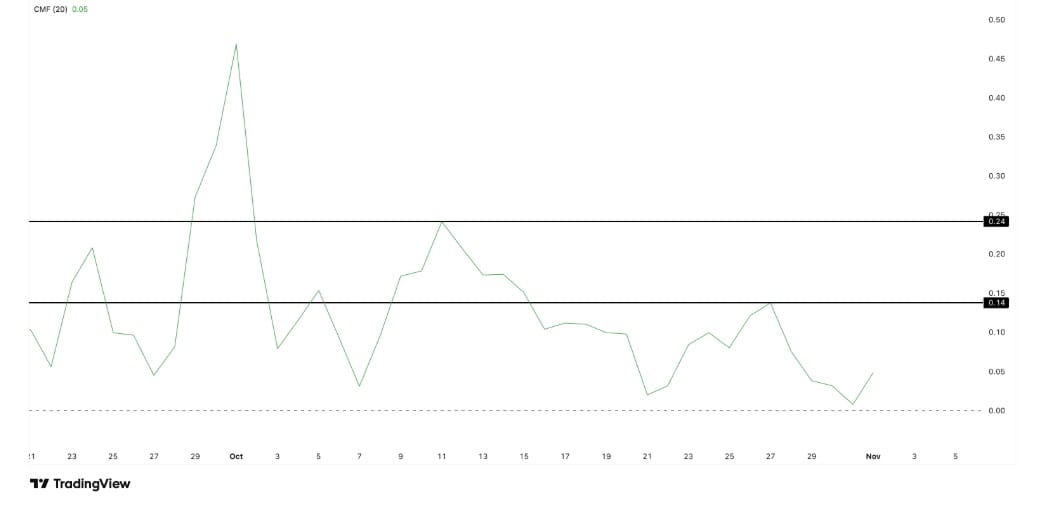
If it rises above 0.14 and moves towards 0.24, it could trigger another wave of buying, potentially driving bigger gains in the near term. It is worth noting that although large flows of money left ZEC in late October, the value never fell below zero.
And the indicator already curved upwards on the first day of November, hinting at a growing conviction of the whale (big investors).
The Leverage Long Increases Confidence - and Risk
The bullish setup has attracted leveraged traders to record levels. According to Bybit's liquidation map, total long leverage in ZEC/USDT pairs is about $32.45 million, while short leverage stands at $1.04 million - almost 30 times lower.
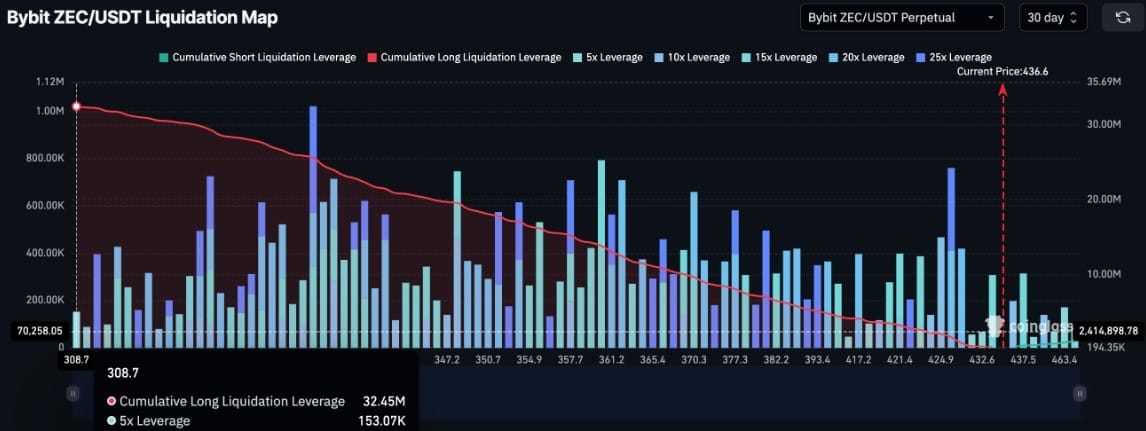
This also means that most traders are betting on continued growth, but it also creates a fragile balance. If the price of Zcash falls even slightly, excessively overleveraged (overexposed) positions could be liquidated quickly, forcing further selling pressure.
This makes $342 and $312 the most important short-term support levels. A drop below $312 could trigger a cascade of liquidations.
ZEC Price Forecast: Can the Rally Surpass $1,500?
The Zcash price continues to trade within a flag-and-pole breakout pattern, a structure that often precedes large upward extensions. The breakout above $438 confirmed the continuation of this move, and the next Fibonacci targets are at $594, $847 and $1,256.
The full pole projection of the flag points to a long-term target of $1,567 - or about a 250% upside from current levels near $437.
However, the sharp rise in Zcash also means volatility will remain high. The combination of a bullish structure, strong cash inflows and excessive leverage makes this run both promising and risky.
For now, the uptrend is holding - but traders need to closely monitor $312, as losing that level could quickly turn the narrative upside down. Breaking above that level would liquidate all existing long positions, according to the liquidation chart.
However, as long as the ZEC price remains above $342 (the 0.618 fib level), any downward movement would look like a healthy pullback. If ZEC were to lose $245, the rally would weaken. And a break below $185 would collapse the entire bullish structure.
Watch our latest YouTube video.