

The price of Ethereum is currently trading around $2,485, having recovered significantly from recent losses following a bounce off a weak low at $2,200 earlier this week. With ETH regaining the major exponential moving averages (EMAs) and invalidating the recent bearish structure (BOS), the rebound was technically flawless.
However, the price is now approaching the lower limit of the stubborn bid zone, which has caused numerous sell-offs in the past, and is between $2.500 and $2,600,
What is happening to ethereum price
The price of Ethereum has recovered sharply from the liquidity freeze between $2.200 and $2,240 in recent days. On 25 June, ETH formed a bullish engulfing candle on the daily chart, followed by a continuation above the 50 EMA. As the daily close recaptured the demand zone at $2,470, this move returned the short-term trend in favour of buyers.
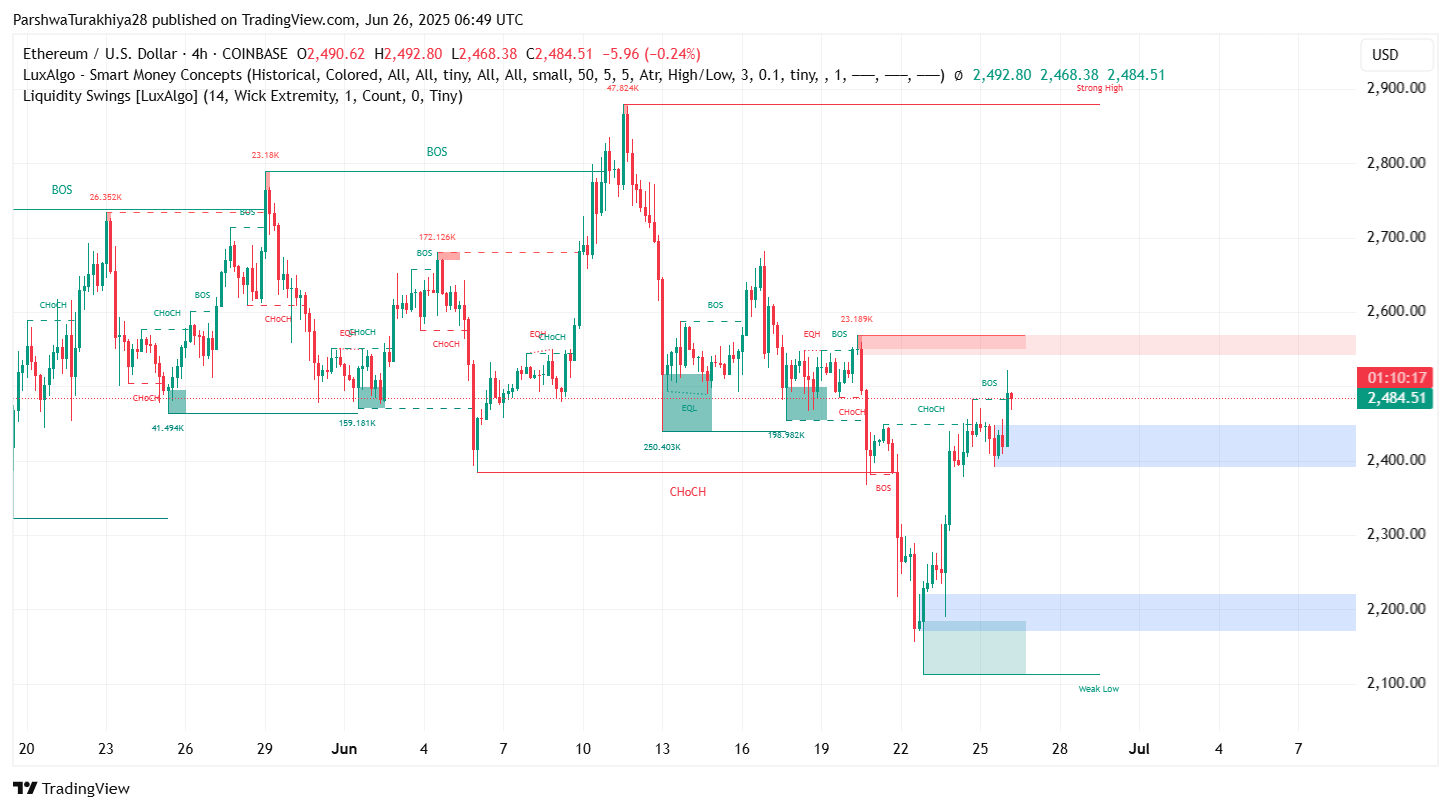
After several unsuccessful attempts, the 4-hour chart shows a new breakout of the structure (BOS) above $2.480, and the Smart Money Concepts tool shows a clear bullish CHoCH in the same area. Between $2,500 and $2,560, ETH is currently putting pressure on a local bid area. If volumes manage to break above this level, the next target could be the 50% weekly Fibonacci zone at $2,746.
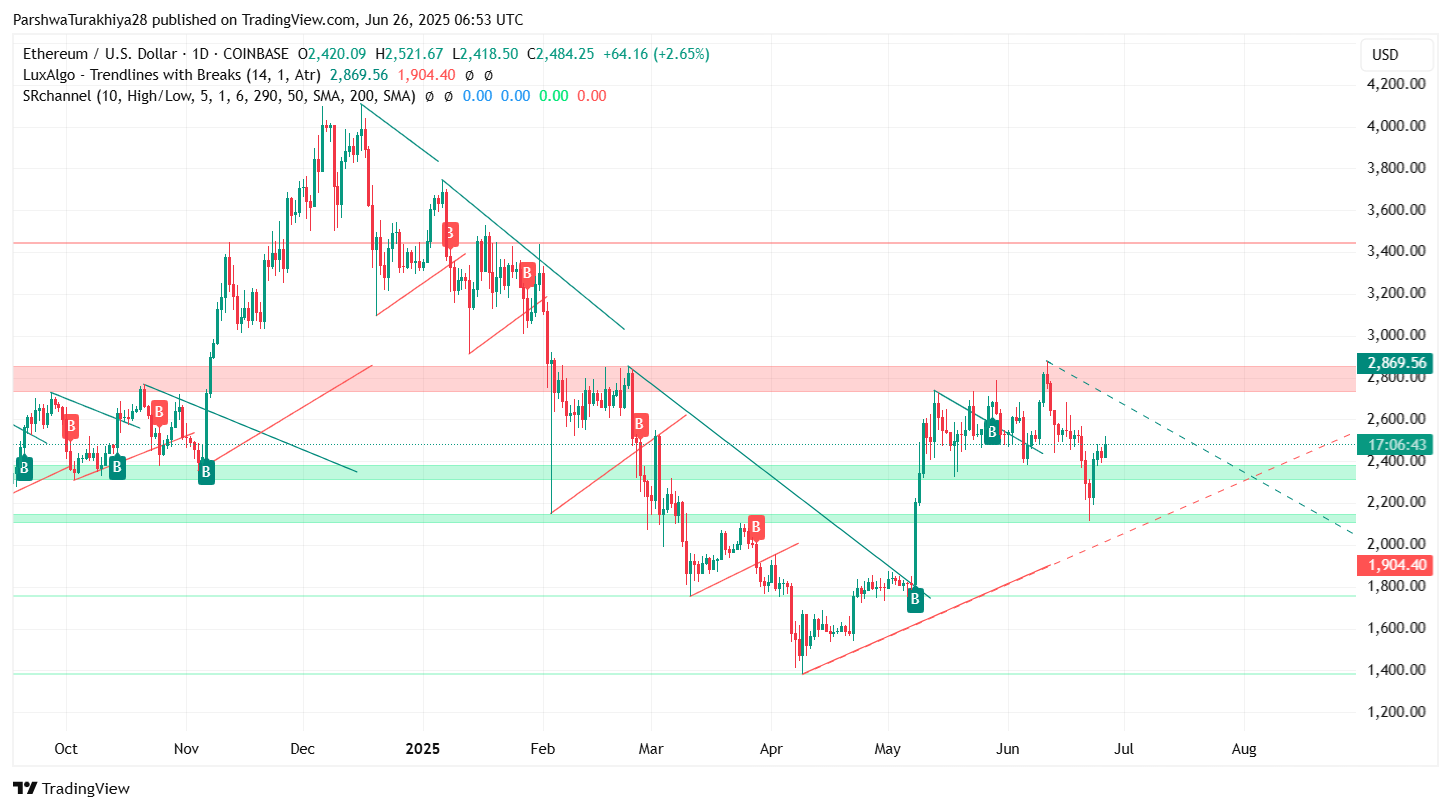
This retest is even more historically significant, as the cluster between $2,420 and $2,480 was also a breakout zone in May. Moreover, the bullish trendline lost last week has now been recaptured by the price.
Why Ethereum's price is rising today
The ETH net flows chart indicates that the strong recovery in spot demand is the main driver of the current rise in Ethereum's price. June 26 saw one of the largest daily inflows in recent weeks, with over $53 million in net inflows.
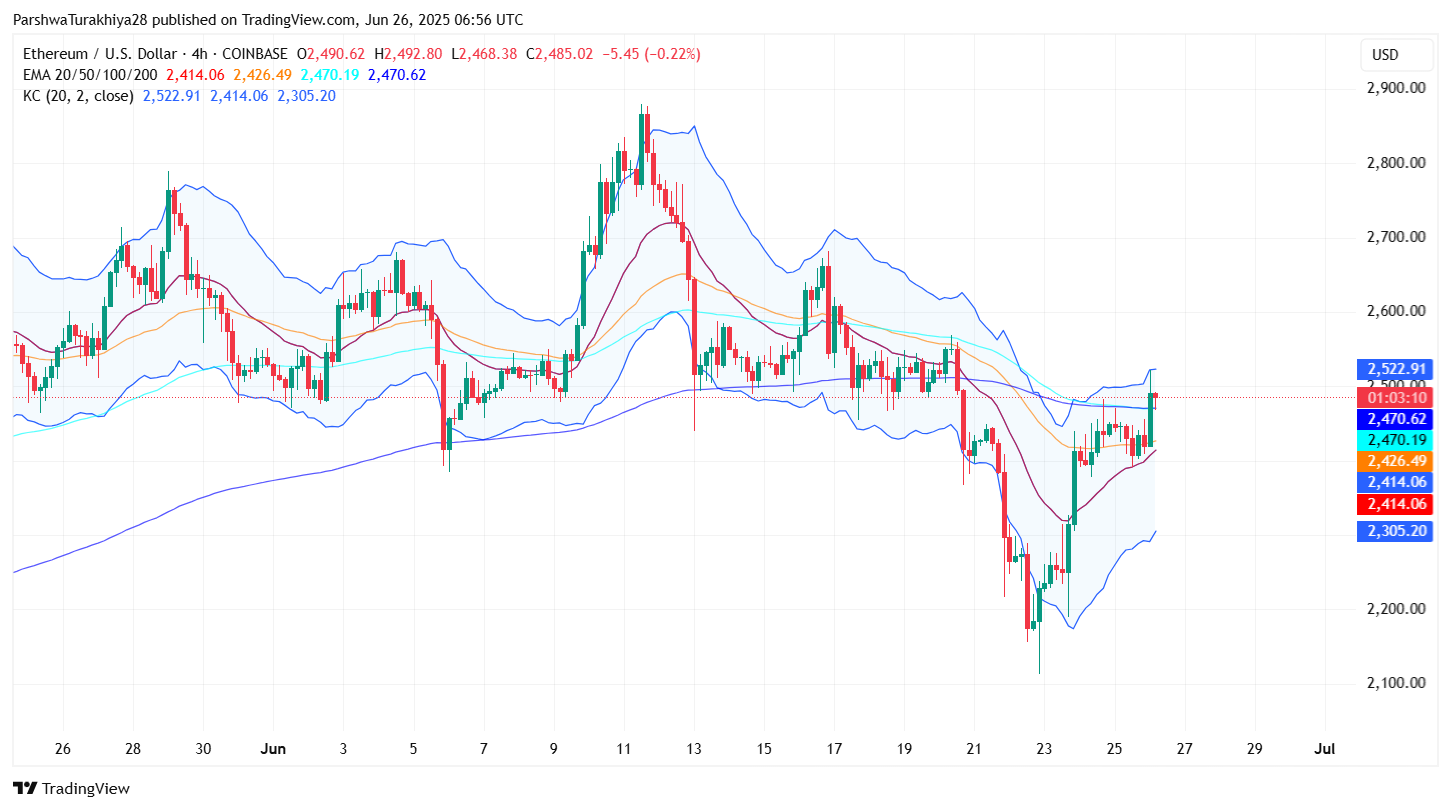
In addition, with the current price of $2.485 above all short-term moving averages, Ethereum has recaptured the 20/50/100 EMA cluster on the 4-hour chart. The Keltner Channel bands on the 4-hour chart are expanding upwards and ETH is following the upper band, signalling strong directional momentum, according to the indicator. The Bollinger Bands on the 4-hour chart are also widening, indicating an increase in Ethereum's price volatility towards the $2,500 region.
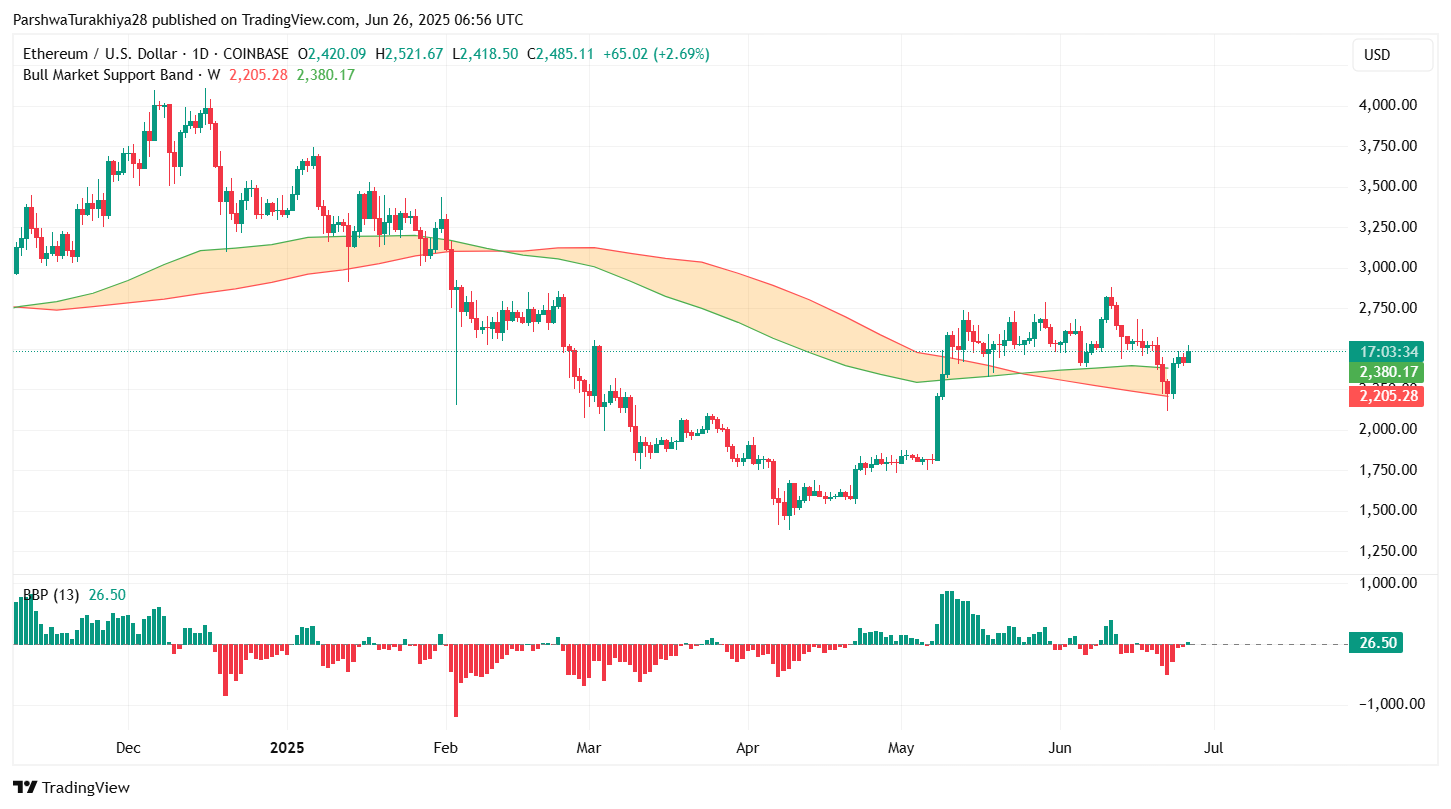
For the first time in a week, ETH closed above the bullish market support band on the daily chart, which previously served as resistance at $2.380.
Ethereum's price indicators signal a crucial test of the area between $2,500 and $2,560.
The price reached the first test of the red bid block between $2.500 and $2,560 on the 4-hour chart. This retest could determine whether ETH will resume its broad bullish trend or turn back, as this area has repelled three previous uptrend attempts in June.
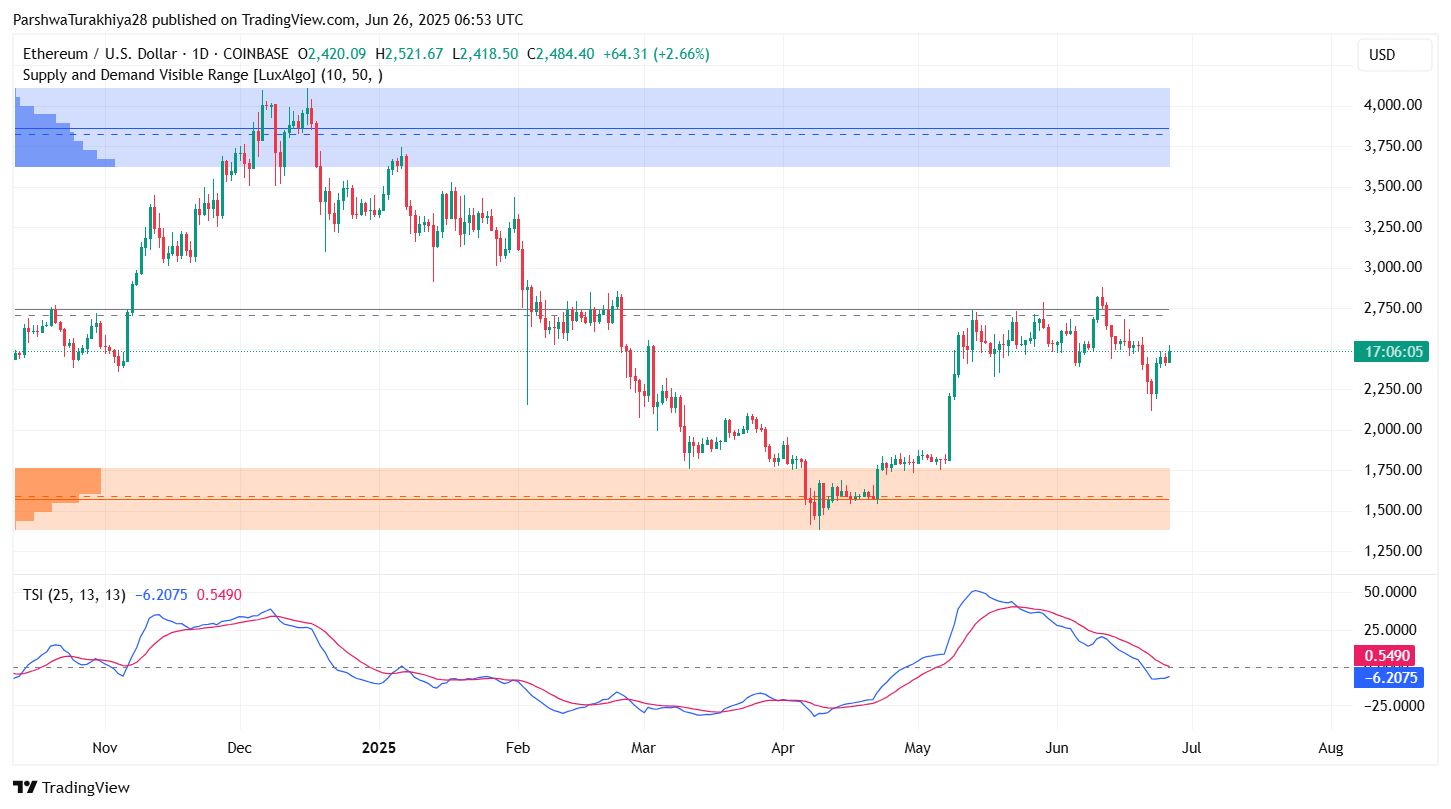
On the daily chart, the True Strength Index (TSI) is starting to climb from extremely negative territory and a positive breakout is expected. If the breakout is successful, this will further strengthen the probability of a bullish continuation.
The weekly Fibonacci retracement chart of Ethereum shows the 0.5 level near $2.746 and the 0.382 level at $2,637. Should volumes break through the $2,560 barrier, both of these levels would represent reasonable upside targets.
On the lower time frames around $2,560, traders should pay attention to the presence of bearish CHoCH zones and equivalent highs. In the absence of strong bullish confirmation, this area could once again act as a trigger for a reversal.