

Bitcoin's market response to the escalating US-Iran conflict is beginning to look remarkably like its price behavior during the first month after Russia's invasion of Ukraine in February 2022. For traders and analysts watching geopolitical risk closely, the parallel is hard to ignore.
A side-by-side comparison of the two episodes reveals a strikingly similar sequence: an initial panic-driven sell-off, a swift recovery, and a volatile consolidation phase as markets recalibrate around the new geopolitical reality.
Initial Shock, Then a Fast Rebound
When Russia invaded Ukraine on February 24, 2022, Bitcoin dropped sharply in line with the global risk-off reaction. Within days, however, the asset staged a decisive recovery as traders began to reassess the actual near-term economic impact of the conflict.
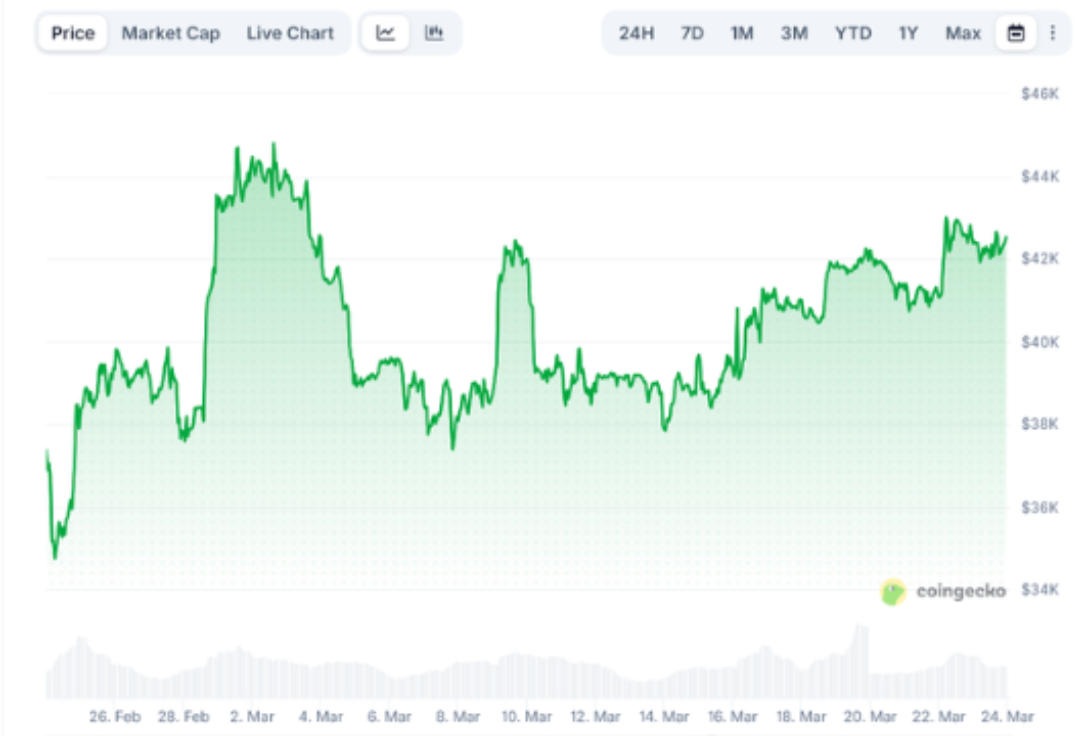
A comparable pattern is now unfolding in the wake of US and Israeli strikes against Iran, which began around February 28, 2026. Bitcoin initially retreated on the news, then quickly recovered, pushing back into the $70,000–$73,000 range in the weeks that followed.
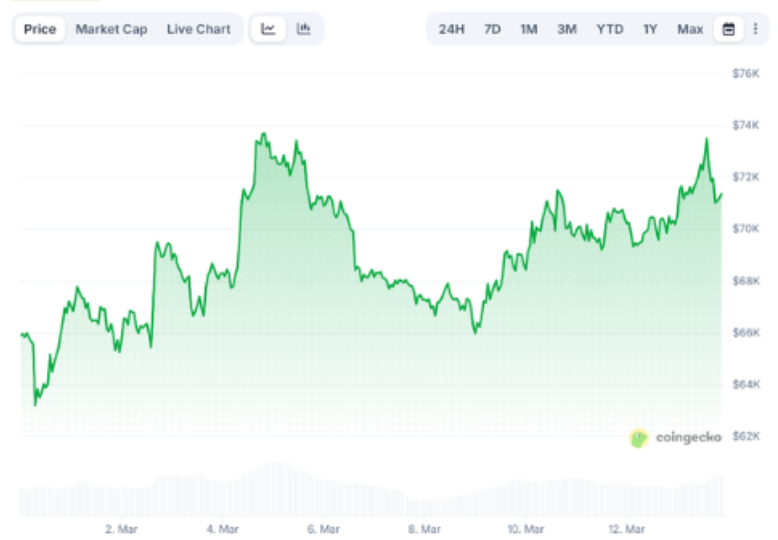
In both cases, the market appears to have rapidly priced in the geopolitical shock before stabilizing — a pattern familiar to those who have watched Bitcoin navigate macro crises.
RSI Shows Similar Momentum Swings
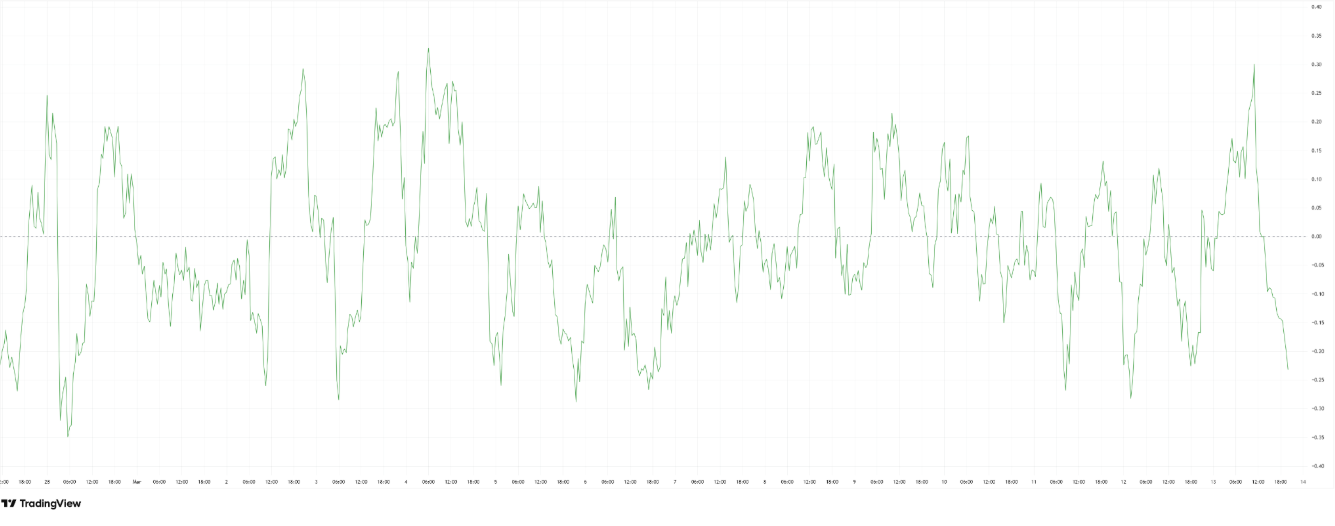
Momentum indicators tell a consistent story. During the first month of the Ukraine war, Bitcoin's Relative Strength Index (RSI) plunged sharply into oversold territory before rebounding into a strong positive momentum phase.
The current RSI trajectory during the Iran conflict mirrors this behavior. The indicator initially fell as markets reacted to the outbreak of hostilities, then bounced into stronger momentum territory before cooling again. This type of movement is a classic signature of panic selling followed by aggressive dip buying — a pattern that has repeatedly appeared during major geopolitical shocks.
Capital Flows Signal Continued Rotation Into Bitcoin
Capital flow indicators reinforce the comparison. During the early stages of the Ukraine war, the Chaikin Money Flow (CMF) gradually recovered after the initial sell-off, signaling renewed buying pressure entering the market.
The current CMF during the Iran conflict shows a similar trend, with repeated moves back into positive territory. This suggests that capital continues to rotate into Bitcoin during price dips. However, the 2026 chart appears more volatile than its 2022 counterpart, indicating short-term trading flows rather than steady, sustained accumulation.
Markets Appear to Be Pricing In War Risk
Taken together, the data suggest that Bitcoin's reaction to the Iran war is following a familiar template. Rather than triggering a prolonged collapse, the geopolitical shock has so far produced a cycle of panic selling, rapid recovery, and sideways volatility within a defined range.
If the pattern continues to mirror the early phase of the Ukraine war, Bitcoin is more likely to trade sideways with a mild upward bias than to collapse outright. A similar trajectory would suggest that Bitcoin may remain volatile in the near term, but gradually drift higher as traders buy dips and the war risk is fully absorbed and priced in by the market.