


On November 20, Bitcoin fell below $60,000 for the first time since July. According to CoinGecko data cited by CryptoTicker, the threshold broke at 15:45 UTC, during the European afternoon with Wall Street already open, and fifteen minutes later the price stood at $59,266. Ether fared worse, dropping between 5% and nearly 8% depending on the time of measurement.
The sell-off hit technology stocks and crypto simultaneously, and Bitcoin moved less like a safe haven and more like a tech equity. For readers new to the asset, our Bitcoin guide covers the fundamentals behind the price.
How Far Did Bitcoin Fall, and From Where?
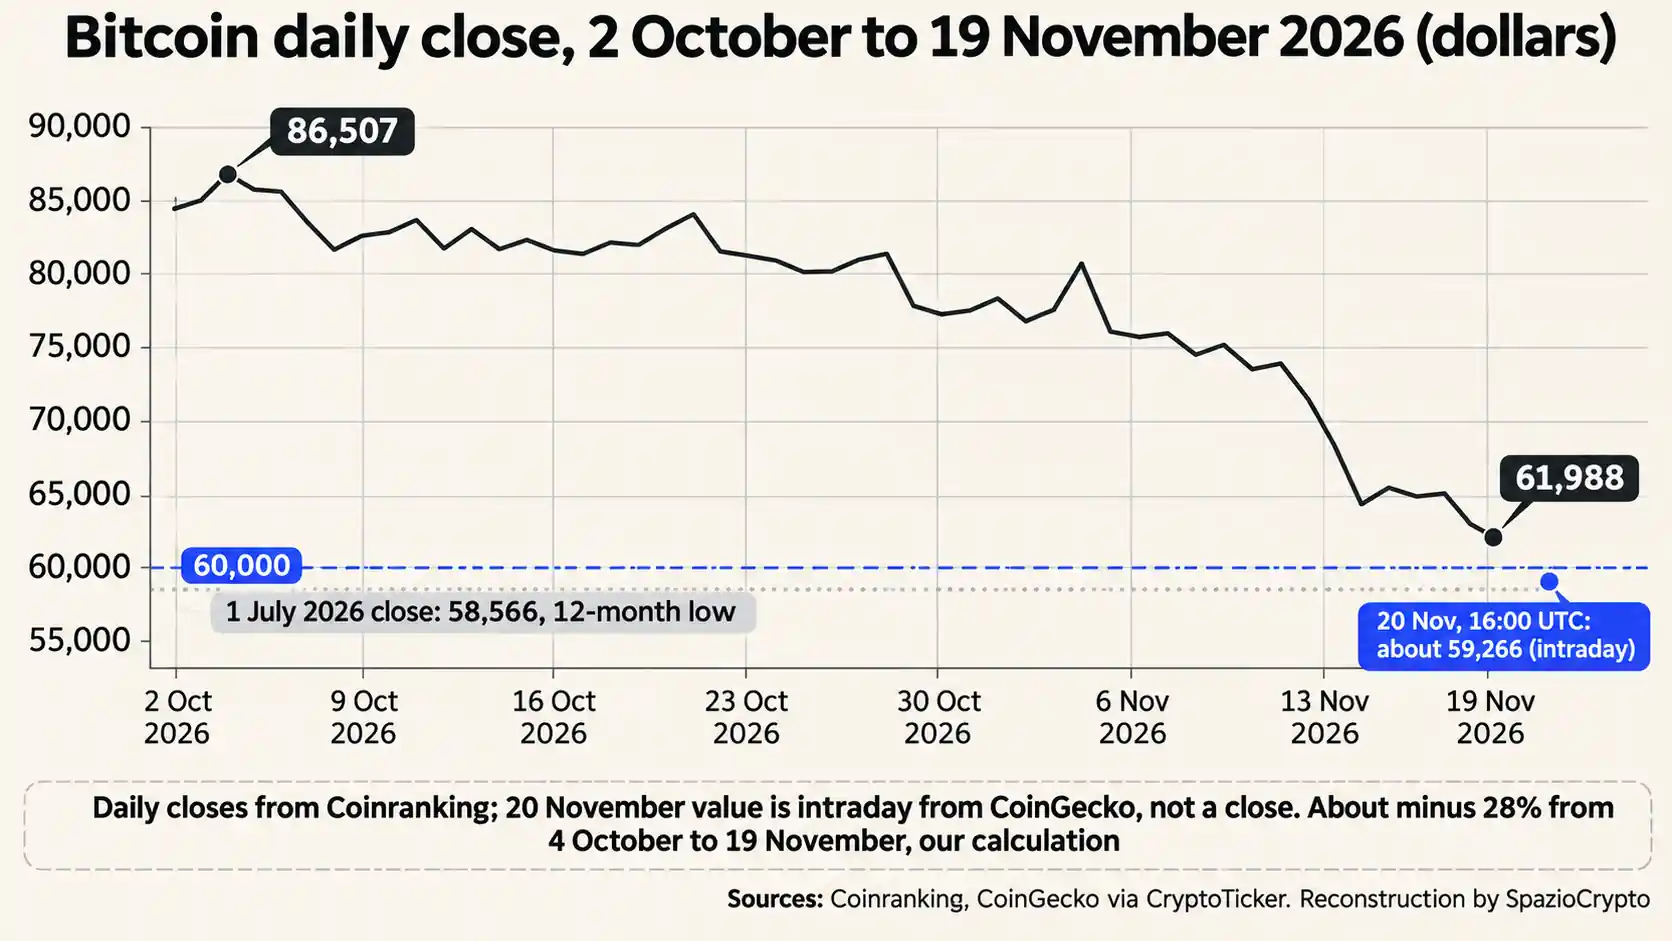
On October 4, Bitcoin closed at $86,507, according to Coinranking historical data. By November 1 it was at $78,337, and on November 19 it sat at $61,988. That represents a 28% decline over six weeks and a 21% drop in November alone, based on our indicative calculation. Per Investing.com data cited by TechStartups, this marked the seventh consecutive week of losses.
Relative to the all-time high of roughly $126,000 reached in October 2025, Friday's price was lower by 53%. Market capitalization fell in roughly the same proportion, since Bitcoin's circulating supply changes very little. The nearest comparable reference point is the July 1 daily closing low of $58,566, according to CoinGecko.
Why Did It Break Now?
The $60,000 floor gave way on the same day Wall Street was dumping AI-related stocks. According to CryptoTicker, Nvidia fell 6% and the Nasdaq dropped 2.4%. Per CNBC, Anthropic opened down 9% on its first full trading day. Doubts about the return on AI infrastructure spending and the prospect of rates staying higher for longer are weighing on sentiment, with the market now pricing in a rate hike rather than a cut.
“Bitcoin has increasingly moved in line with other growth assets sensitive to liquidity,” said James Butterfill of CoinShares, as reported by Startup Fortune. It's the same dual exposure seen in Bitcoin miners that have pivoted to AI data centers, companies now tied to both Bitcoin's price and the broader market's verdict on artificial intelligence.
Who Was Selling?
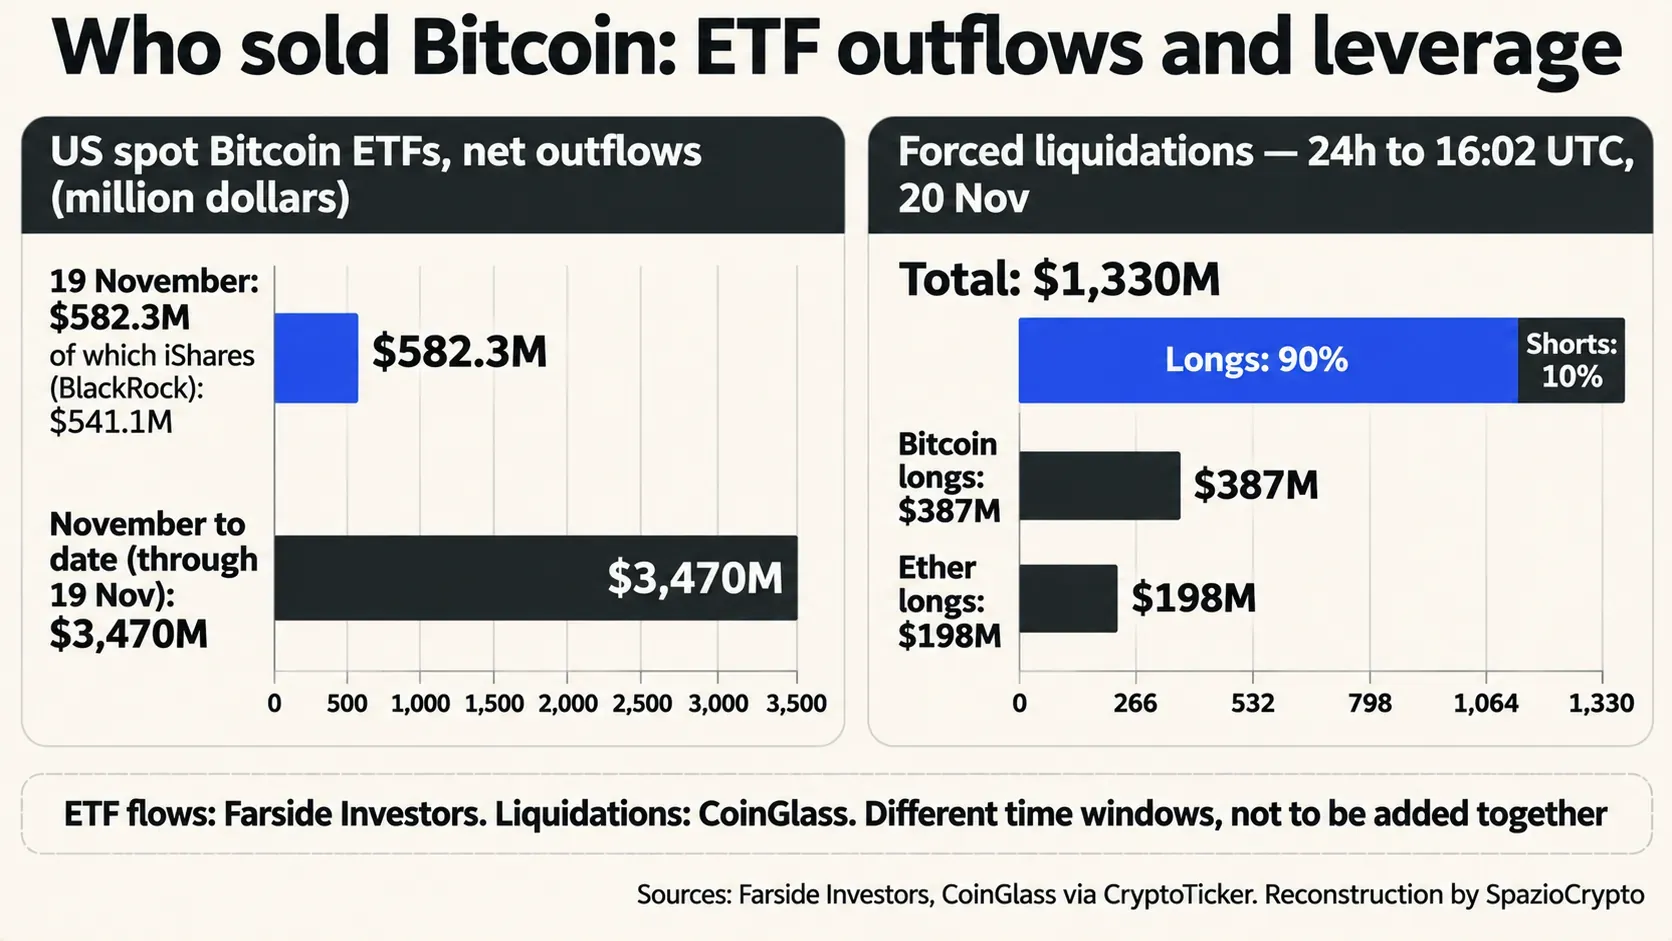
Two distinct flows explain the speed of the decline. The first involves US spot Bitcoin ETFs. According to Farside Investors, cited by CryptoTicker, on November 19 these funds recorded net outflows of $582.3 million, with $541.1 million of that coming from BlackRock's iShares Bitcoin Trust. It was the third consecutive day of outflows, and cumulative November outflows have now reached $3.47 billion.
The second driver was leverage. According to CoinGlass, in the 24 hours to 16:02 UTC on November 20, $1.33 billion in positions were forcibly closed, 90% of which were long positions. The mechanism resembles a chain of falling dominoes: each liquidation triggers selling, pushes the price lower, and topples the next position in line. Anyone using leverage, including through products like 2x and 3x leveraged crypto ETFs, sees every move amplified.
What Does Sentiment Say?
The Fear & Greed Index from Alternative.me registered 12, deep in the “Extreme Fear” zone, according to CryptoTicker. Santiment, which tracks its own sample of social channels rather than the full market, also weighed in on the mood shift.
🚨 Bitcoin Sentiment Bleeds As Retail Patience Finally Breaks With Drop Below $60K!
— Santiment Intelligence (@SantimentData) November 20, 2026
😨 Bitcoin's bullish-to-bearish comment ratio has fallen to just 0.59 as BTC breaks below $60K, making this an 'Extreme Fear' zone. Bearish comments now heavily outnumber bullish ones, continuing… pic.twitter.com/wqMTfhNwxL
Extreme fear readings aren't a reliable reversal signal on their own. Back in February, the index dropped to 7, according to Cointelegraph, and the price returned below $60,000 between June and July before sliding there again now. Alexander Blume of Two Prime believes sellers and liquidations are “largely exhausted,” as reported by Startup Fortune.
Bitcoin Below $60,000: What's Confirmed and What Isn't
What we know and what remains open
- Confirmed: On November 20, Bitcoin fell below $60,000 for the first time since July, touching approximately $59,266 at 16:00 UTC. Ether declined between 5% and 7.6%. CoinGlass recorded $1.33 billion in liquidations over 24 hours, 90% long. Farside Investors reported $582.3 million in Bitcoin spot ETF outflows on November 19.
- Not yet known: the final closing price for November 20, same-day ETF flow data, and the precise contribution of large holders to the sell-off.
- To watch: whether Bitcoin holds the July 1 daily closing low of $58,566, next week's ETF flow data, and rate expectations ahead of the Fed's December meeting.
The Bigger Picture
Our read, stated as such: on November 20, Bitcoin didn't act as a safe haven. It acted as an amplifier. On the worst day for AI-linked equities, Bitcoin lost more ground than the Nasdaq. The capital driving it right now is largely the same capital that prices technology risk: ETFs, funds, and leveraged operators.
The signal to watch is the July 1 daily closing low of $58,566, the lowest print in the past twelve months. Bitcoin spot ETF flows also matter, having already shed $3.47 billion in November, as do the balance sheets of companies holding Bitcoin in treasury, a dynamic we tracked closely with the Strategy case.